
Clearwater Analytics Holdings, Inc. (CWAN): Price and Financial Metrics
CWAN Price/Volume Stats
| Current price | $16.96 | 52-week high | $21.89 |
| Prev. close | $15.82 | 52-week low | $13.02 |
| Day low | $16.47 | Volume | 726,380 |
| Day high | $17.21 | Avg. volume | 1,206,511 |
| 50-day MA | $17.10 | Dividend yield | N/A |
| 200-day MA | $18.53 | Market Cap | 4.15B |
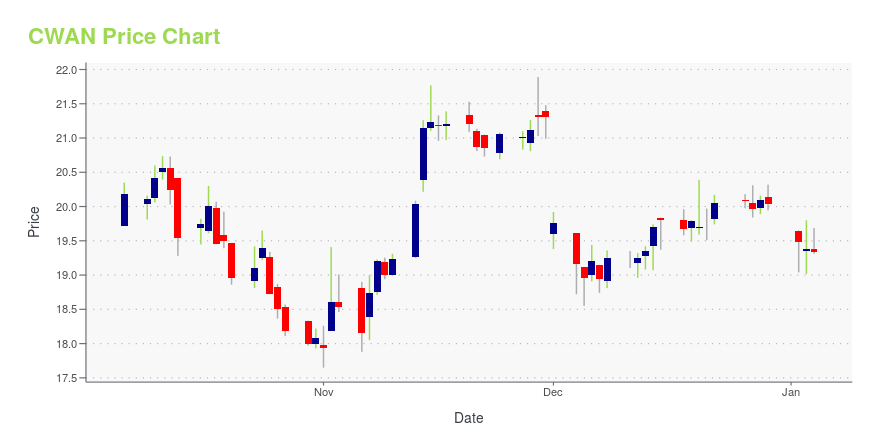
CWAN Stock Price Chart Interactive Chart >
Clearwater Analytics Holdings, Inc. (CWAN) Company Bio
Clearwater Analytics Holdings, Inc. develops and provides a SaaS solution for automated investment accounting, data management, and reporting. The company offers Clearwater, an automated data aggregation and reporting solution for investment portfolio data. It offers reporting tools, such as compliance policy monitoring, performance measurement, and risk analysis. The company serves corporations, insurers, investment managers, and institutions. Clearwater Analytics Holdings, Inc. was incorporated in 2021 and is based in Boise, Idaho. It has additional offices in New York, New York; London and Edinburgh, United Kingdom; Noida, India; Paris, France; and Singapore.
Latest CWAN News From Around the Web
Below are the latest news stories about CLEARWATER ANALYTICS HOLDINGS INC that investors may wish to consider to help them evaluate CWAN as an investment opportunity.
Clearwater Analytics Holdings, Inc. (NYSE:CWAN) is largely controlled by institutional shareholders who own 59% of the companyKey Insights Given the large stake in the stock by institutions, Clearwater Analytics Holdings' stock price might be... |
New Clearwater Analytics Report Highlights Key Considerations for APAC Insurers in 2024Clearwater Analytics (NYSE: CWAN), a leading provider of SaaS-based investment management, accounting, reporting, and analytics solutions, today published its 2024 Hong Kong & Singapore Insurance Industry Outlook report. The survey, conducted in October and November of 2023, engaged over 80 insurers and insurance asset managers in Hong Kong and Singapore, representing over $2.5 trillion in assets under management. |
Is Clearwater Analytics Holdings (CWAN) a Good Fit for Your Portfolio?TimesSquare Capital Management, an equity investment management company, released its “U.S. Small Cap Growth Strategy” third-quarter investor letter. A copy of the same can be downloaded here. In the quarter the fund returned -3.67% (net), compared to -7.32% return for the Russell 2000 Growth Index. Year-to-date the fund returned 11.56% (net) compared to 9.59% return for […] |
Clearwater Analytics Announces Launch of Secondary Offering of Class A Common StockClearwater Analytics Holdings, Inc. ("Clearwater" or the "Company") (NYSE: CWAN), a leading provider of SaaS-based investment management, accounting, reporting, and analytics solutions, today announced that it has launched an underwritten secondary public offering of an aggregate of 17,000,000 shares of the Company's Class A common stock, par value $0.001 per share (the "Common Stock"). The Company is conducting a resale of Common Stock on behalf of certain affiliates of each of Welsh, Carson, A |
Clearwater Analytics (CWAN) Reports Q3 Earnings: What Key Metrics Have to SayWhile the top- and bottom-line numbers for Clearwater Analytics (CWAN) give a sense of how the business performed in the quarter ended September 2023, it could be worth looking at how some of its key metrics compare to Wall Street estimates and year-ago values. |
CWAN Price Returns
| 1-mo | -1.40% |
| 3-mo | -11.94% |
| 6-mo | -8.47% |
| 1-year | 14.98% |
| 3-year | N/A |
| 5-year | N/A |
| YTD | -15.33% |
| 2023 | 6.83% |
| 2022 | -18.41% |
| 2021 | N/A |
| 2020 | N/A |
| 2019 | N/A |
Loading social stream, please wait...