
PolarityTE, Inc. (PTE): Price and Financial Metrics
PTE Price/Volume Stats
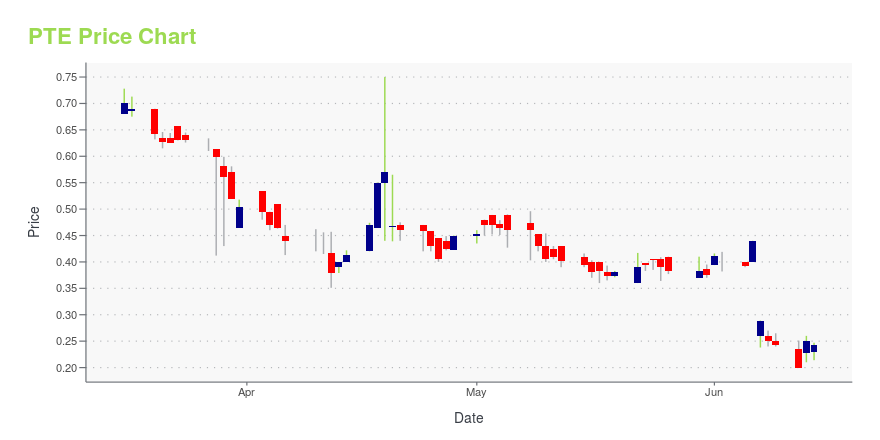
| Current price | $0.24 | 52-week high | $1.90 |
| Prev. close | $0.24 | 52-week low | $0.20 |
| Day low | $0.23 | Volume | 8,503,300 |
| Day high | $0.25 | Avg. volume | 249,591 |
| 50-day MA | $0.40 | Dividend yield | N/A |
| 200-day MA | $0.66 | Market Cap | 1.78M |
PTE Stock Price Chart Interactive Chart >
PolarityTE, Inc. (PTE) Company Bio
PolarityTE, Inc. operates as a translational regenerative medicine company. The Company develops functionally polarized human tissues to improve clinical medicine and biomedical research. PolarityTE offers its services in the United States.
Latest PTE News From Around the Web
Below are the latest news stories about POLARITYTE INC that investors may wish to consider to help them evaluate PTE as an investment opportunity.
Today’s Biggest Pre-Market Stock Movers: 10 Top Gainers and Losers on ThursdayIt's time to start breaking down the biggest pre-market movers for Thursday as we get ready for another busy day of trading! |
Today’s Biggest Pre-Market Stock Movers: 10 Top Gainers and Losers on TuesdayIt's time to start off the day right with a dive into the biggest pre-market stock movers worth watching on Tuesday morning! |
Today’s Biggest Pre-Market Stock Movers: 10 Top Gainers and Losers on WednesdayWe're starting the day off right with a breakdown of the biggest pre-market stock movers worth reading about on Wednesday! |
PolarityTE, Inc. (PTE) May Find a Bottom Soon, Here's Why You Should Buy the Stock NowPolarityTE, Inc. (PTE) appears to have found support after losing some value lately, as indicated by the formation of a hammer chart. In addition to this technical chart pattern, strong agreement among Wall Street analysts in revising earnings estimates higher enhances the stock's potential for a turnaround in the near term. |
PolarityTE Full Year 2022 Earnings: EPS Misses ExpectationsPolarityTE ( NASDAQ:PTE ) Full Year 2022 Results Key Financial Results Net loss: US$7.83m (loss narrowed by 74% from FY... |
PTE Price Returns
| 1-mo | N/A |
| 3-mo | N/A |
| 6-mo | N/A |
| 1-year | -47.83% |
| 3-year | -99.03% |
| 5-year | -99.89% |
| YTD | N/A |
| 2023 | 0.00% |
| 2022 | -95.54% |
| 2021 | -13.68% |
| 2020 | -73.85% |
| 2019 | -80.73% |
Loading social stream, please wait...